The Market Potential for Chestnuts: Where are we now? Where are we going?
Welcome to the first blog post here at Lola’s. We plan to use this blog to tackle a number of chestnut related topics. Our first efforts though will focus on describing the chestnut industry, beginning with this post on the current and projected supply of chestnuts in the U.S. Our next post will explore prices and plausible scenarios for demand growth in the U.S. Future posts will explore the global market for chestnuts.
At this point, I should make it clear that I’m an economist. I love analyzing and visualizing data. I love a good graph. And, most importantly, I love giving people actionable information. So, let’s dive in.
The Data
First, I want you to know where all of the data I’m about to use come from. The good people at the Economic Research Service at USDA have been collecting data on various tree nut crops (and many others) for quite some time. This particular dataset goes back to 1981 and ends in 2024. You can access it here (just scroll down to “Tree Nuts” and click on “Download CSV”). The .csv file contains a range of data on Almonds, Hazelnuts, Pecans, Pistachios, and Walnuts. The main variable of interest today is “Supply”.
The data supporting current estimates of chestnut production come from three places: here , here, and here. The first two articles are both good reading. However, neither of these successfully produces a clear, sensible forecast for chestnut production in the U.S. We will try to fill in the gaps.
How big is the industry right now?
As of 2022, the USDA estimates that the US had roughly 4,419 acres of nut-bearing chestnuts, with another 5,700 planted acres that were non-bearing. If we assume those bearing acres include trees that range from 10-30 years old then we might assume an average output per acre of 2,000 lbs., putting our overall estimate of current production at roughly 8.8 Million lbs. (FYI, this estimate is pretty close to the estimate from Agroforestry Partners.). It would be reasonable to assume too that some of those 5,700 acres have moved into production by now. Let’s call it an even 10 Million lbs., excluding imports.
How young is this industry?
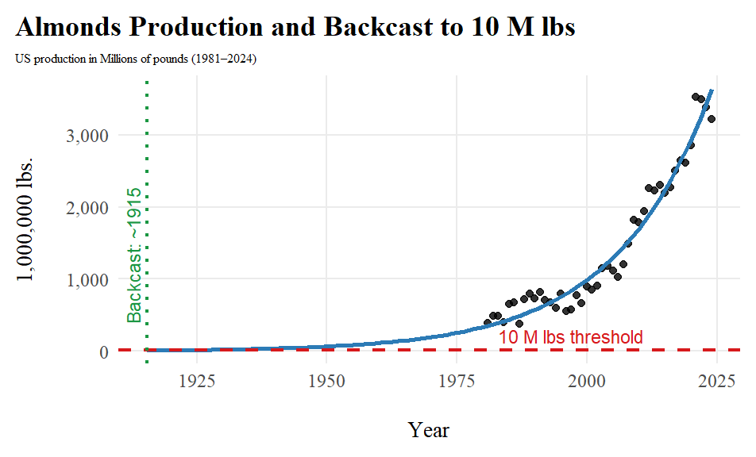
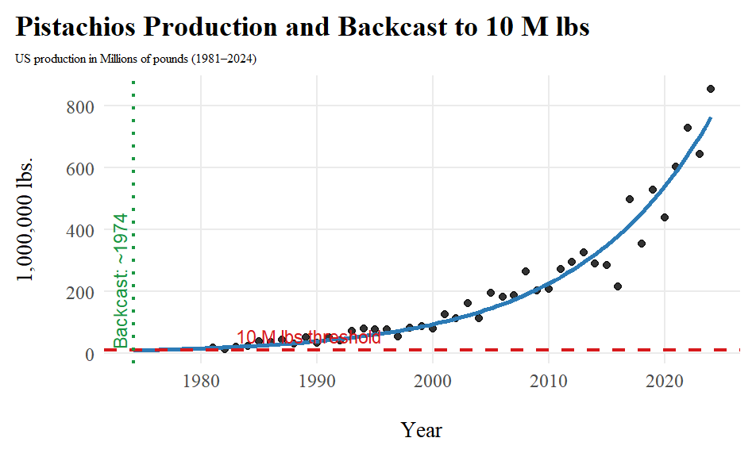
We can use our estimate of current production to get a sense for how young this industry is. Using the data from USDA, I fit the appropriate growth curve (exponential in all cases) to each tree nut commodity from 1981 - 2024. Then, using that resulting equation, I estimate the year that commodity reached 10 Million lbs. of production.
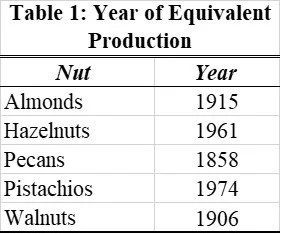
Table 1 below illustrates the results of that analysis. The chestnut industry is over 100 years behind the Almond, Pecan, and Walnut industries. The contemporary nuts - Hazelnuts and Pistachios - have a 50 to 60 year head start. In short, there is a long way to go before this industry catches up with the other nut commodities.
How big is it likely to get?
Estimating the path of the industry by itself is essentially impossible, given that we don’t really have any data on domestic chestnut production. But, we do have lots of data on all of these other nuts, and we can put that to use to model alternative growth scenarios. I decided to use the Hazelnut, Pistachio, and Almond industries as my proxies. These three curves provide a conservative estimate (Hazelnuts), a moderate growth story (Almonds), and an aggressive story (Pistachios).
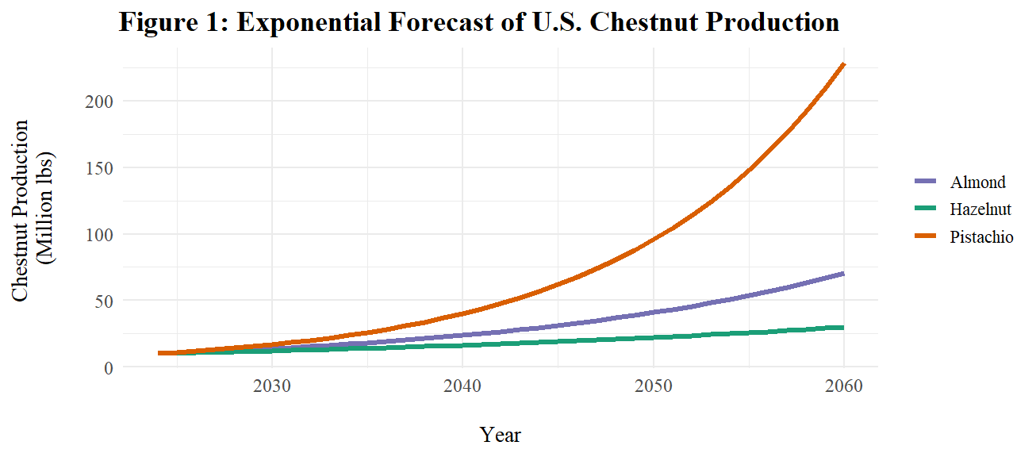
Figure 1 highlights these three paths. The conservative path - that of the Hazelnut industry (which has grown at basically 3% per year) - would put the chestnut industry at more than 30 Million lbs. by 2060, a 3-fold increase over the next 35 years. At this rate, the industry would add nearly 860,000 lbs. per year in production. At 2,000 lbs. per acre, that’s 430 new acres of production each year for the next 35 years. Of course, those new acres are going to be newly bearing, meaning they won’t produce anything close to 2,000 lbs. Let’s just round up slightly then and say this growth path suggests something closer to 500 newly bearing acres of chestnuts each year.
The more seemingly sensible growth path is that of almonds. Yes, it’s a massive industry. As we noted above, the chestnut industry is an infant compared to it. But, its growth rate is moderate (5.4% per year). That projection can be seen in the middle curve in Figure 1. By 2060, that growth path would have the chestnut industry producing more than 70 Million lbs. of chestnuts - a 7-fold increase from today. Annually, that would require 2 Million new lbs. of production each year on something over 1,000 newly bearing acres each year.
Finally, we see the Pistachio industry. There are a number of reasons why this is probably the better proxy of the three. But, for now let’s just see what it’s saying. The top curve (which grows at 8.7% annually) in Figure 1 would see the chestnut industry explode post 2040, blossoming to an industry that produces almost 230 Million lbs. of nuts. By 2060, the industry would be 23 times larger than it is today. This would require a stunning transformation . To meet this growth projection, the industry would need to produce more than 6 Million lbs. of new nuts grown on 3,123 newly bearing acres, per year. With an average orchard size of 3.5 acres, that would call for nearly 900 new chestnut farms each year.
Remarkably, the pistachio growth process is currently the most likely scenario. Agroforestry Partners has taken a good crack at projecting chestnut supply out to roughly 2035. Their projection is quite optimistic, too optimistic for me and the chestnut farmers I talk to. But, even if we ratchet their estimate down say 20% (to account for crop failures, losses, unproductive acres, etc.) that resulting estimate (45 Million lbs.) is still well above the pistachio growth process in 2035 (26 Million lbs.).
Putting it all together
We have our own chestnut orchard and we sell chestnut trees. We are biased. We think these trees are wonderful and their fruit tastes great. So, of course you would expect to see some good looking projections here. But, we wouldn’t be in this industry if we hadn’t done our homework.
The chestnut industry is very young. It’s anywhere between 50 and 100+ years behind the growth and development of other nut crops.
Of the two contemporary nut markets, the hazelnut growth process is frankly unlikely. It’s just not as profitable as chestnuts. They make a mean spread, but the nuts just don’t have the market demand that chestnuts do. The pistachio growth process is far more likely, a sentiment shared by propagateag.com. Information spreads fast these days. Farmers, city-folk like me, and big-time investors see the market potential. There is simply too much profit to be had if this market scales up.
As an economist, I tend to bet on profits. We’ve got some thoughts about how this industry should evolve, but we will save that post for a later date. For now, we will leave this here (along with a few of extra graphs for you to enjoy).
The next post though will tackle the big question facing farmers and wholesalers right now: What’s going to happen to the (inflation-adjusted) price per lbs. as all of this new supply comes on-line? If the past is any guide, that answer is likely “not much”.
Check out the exponential fits below in the gallery. You may need to open them in a new tab to see the full image.